
Anatomy of Prestartr Analytics+ Dashboards

Prestartr Analytics+ Dashboards consist of two primary areas: the Widget space (where your data is visualized) and the Filters space (where you refine the data). This guide covers how to interact with these areas to get the most out of your data.
Interacting with Widgets
|
Widgets are the charts and tables on your dashboard. Most widgets are interactive, allowing you to filter the entire dashboard by clicking on specific data points.
Filter via Widget: Left-click an item (like a slice of a pie chart or a bar) to automatically apply a filter for that item across the whole dashboard.
Multiple Selections: Hold Ctrl (Windows) or Option (Mac) while clicking. A menu will appear—click Select to apply. 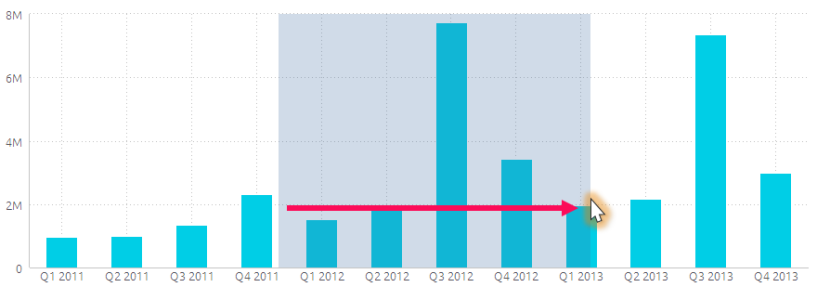 |
 
|
Clearing Selections

When you select data in a widget, a filter is added to the Filters panel.
To go back: Click the [Clear selection] button that appears inside the widget.
Or, manually remove the filter from the Filters panel on the right.
Drilling Down into Data
"Drilling" allows you to look deeper into a specific category (e.g., seeing "Plant Availability" after clicking on "Plant Category").
How to Drill: Right-click a data point and select Drill Into. Choose a field from the list or select a predefined path.
Drilling by Date: You can drill into dates to move from Years → Quarters → Months → Days.
How to Go Back: Use the "breadcrumbs" (navigation links) at the top of the widget to move back up a level, or click the X to reset the widget entirely.
|
 |
 |
Using Filters
The Filters panel on the right controls what data is displayed across all widgets.
Adjusting Filters: Click a filter in the panel to change its value. The dashboard updates immediately.
Default Filters: If you have a specific setup you use often, click the Filters menu and select Set as My Default Filters. You can return to this state anytime by clicking the Restore icon.

Toggle Off: Use the switch next to a filter to temporarily disable it without deleting it.
Note: Filters are personal. Changing them only affects your view, not other users.

Sharing & Exporting
You can export your insights in various formats for presentations or offline analysis.
Exporting Individual Widgets
Click the three dots to reveal the context menu - click Download to see available options for the chosen widget.
Consult the table below to see what export options are available for each widget type.
| Widget Type | Download as CSV | Download as Excel | Download as Image | Download as PDF |
| Area Chart |  |
|
||
| Area Map | |
|
||
| Bar Chart | |
|
||
| Box and Whisker Plot | |
|
||
| Calendar Heatmap | |
|
||
| Column Chart | |
|
||
| Funnel Chart | |
|
||
| Indicator | |
|
||
| Line Chart | |
|
||
| Pie Chart | |
|
||
| Pivot Chart | |
|
|
|
| Polar | |
|
||
| Scatter Chart | |
|
||
| Scatter Map | |
|
||
| Sunburst | |
|
||
| Table | |
|
|
|
| Treemap | |
|